
A developer told me he would need two days to complete a task. I planned for five. He was puzzled. After five days, the task was finished. He was surprised. I wasn’t.
I have been leading development and project teams for two decades and have developed an empirical adjustment factor for myself: 2.5. I apply it to most estimates. Anything estimated to take five days actually takes at least twelve.
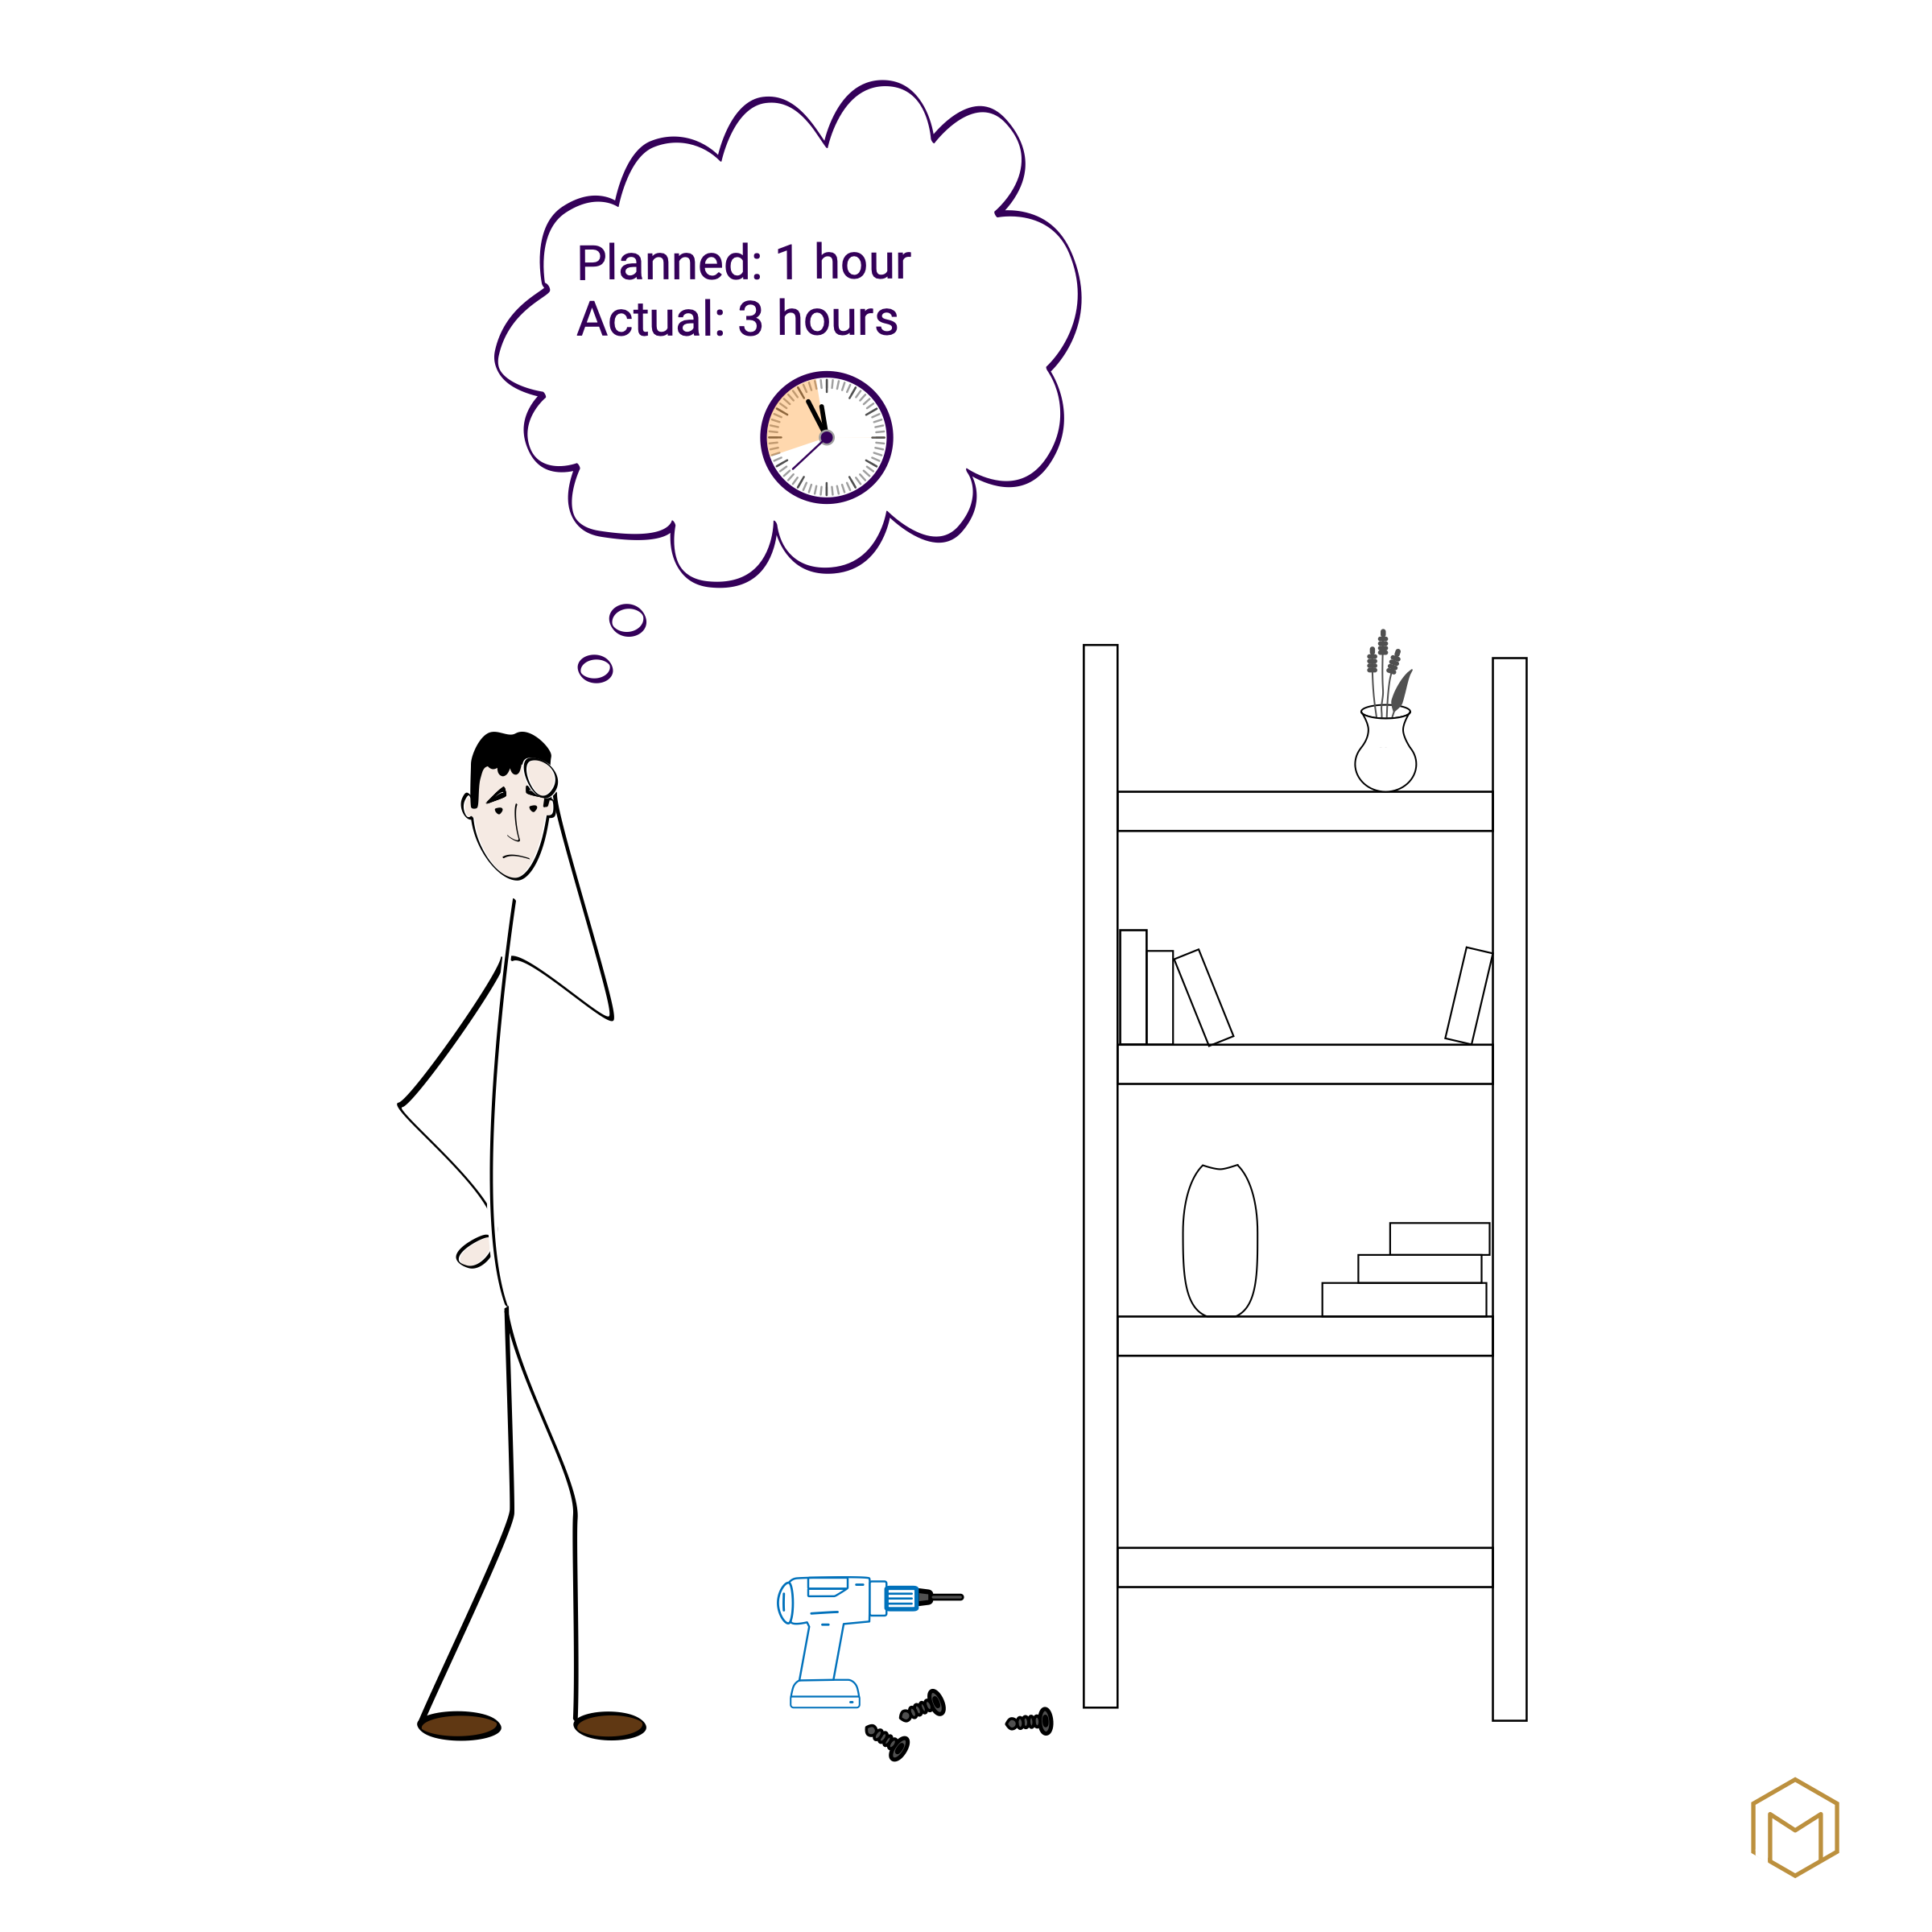
This phenomenon has a name in science.
What the planning fallacy is
The Planning Fallacy describes the systematic tendency to underestimate the duration and cost of future tasks. Kahneman and Tversky coined the term in the 1970s. Since then, the effect has been empirically confirmed hundreds of times: amongst students, engineers and software developers.
The classic study
The canonical evidence was provided by Roger Buehler, Dale Griffin and Michael Ross in 1994. They asked students to estimate when they would complete their final-year dissertations. Two questions were asked.
- The first: If everything goes well, when will you be finished?
- The second: If you were to make a realistic estimate, when will you be finished?
The result: The optimistic estimate averaged 27 days. The realistic estimate averaged 34 days. The actual processing time averaged 55 days. Even the pessimistic estimate was regularly exceeded by 20 per cent.
The hard empirical evidence
What elevates this subject from laboratory research to solid economic science is the work of Bent Flyvbjerg at the University of Oxford. He has spent over two decades collecting and analysing data on real-world major projects. His database comprises more than 16,000 projects worldwide.
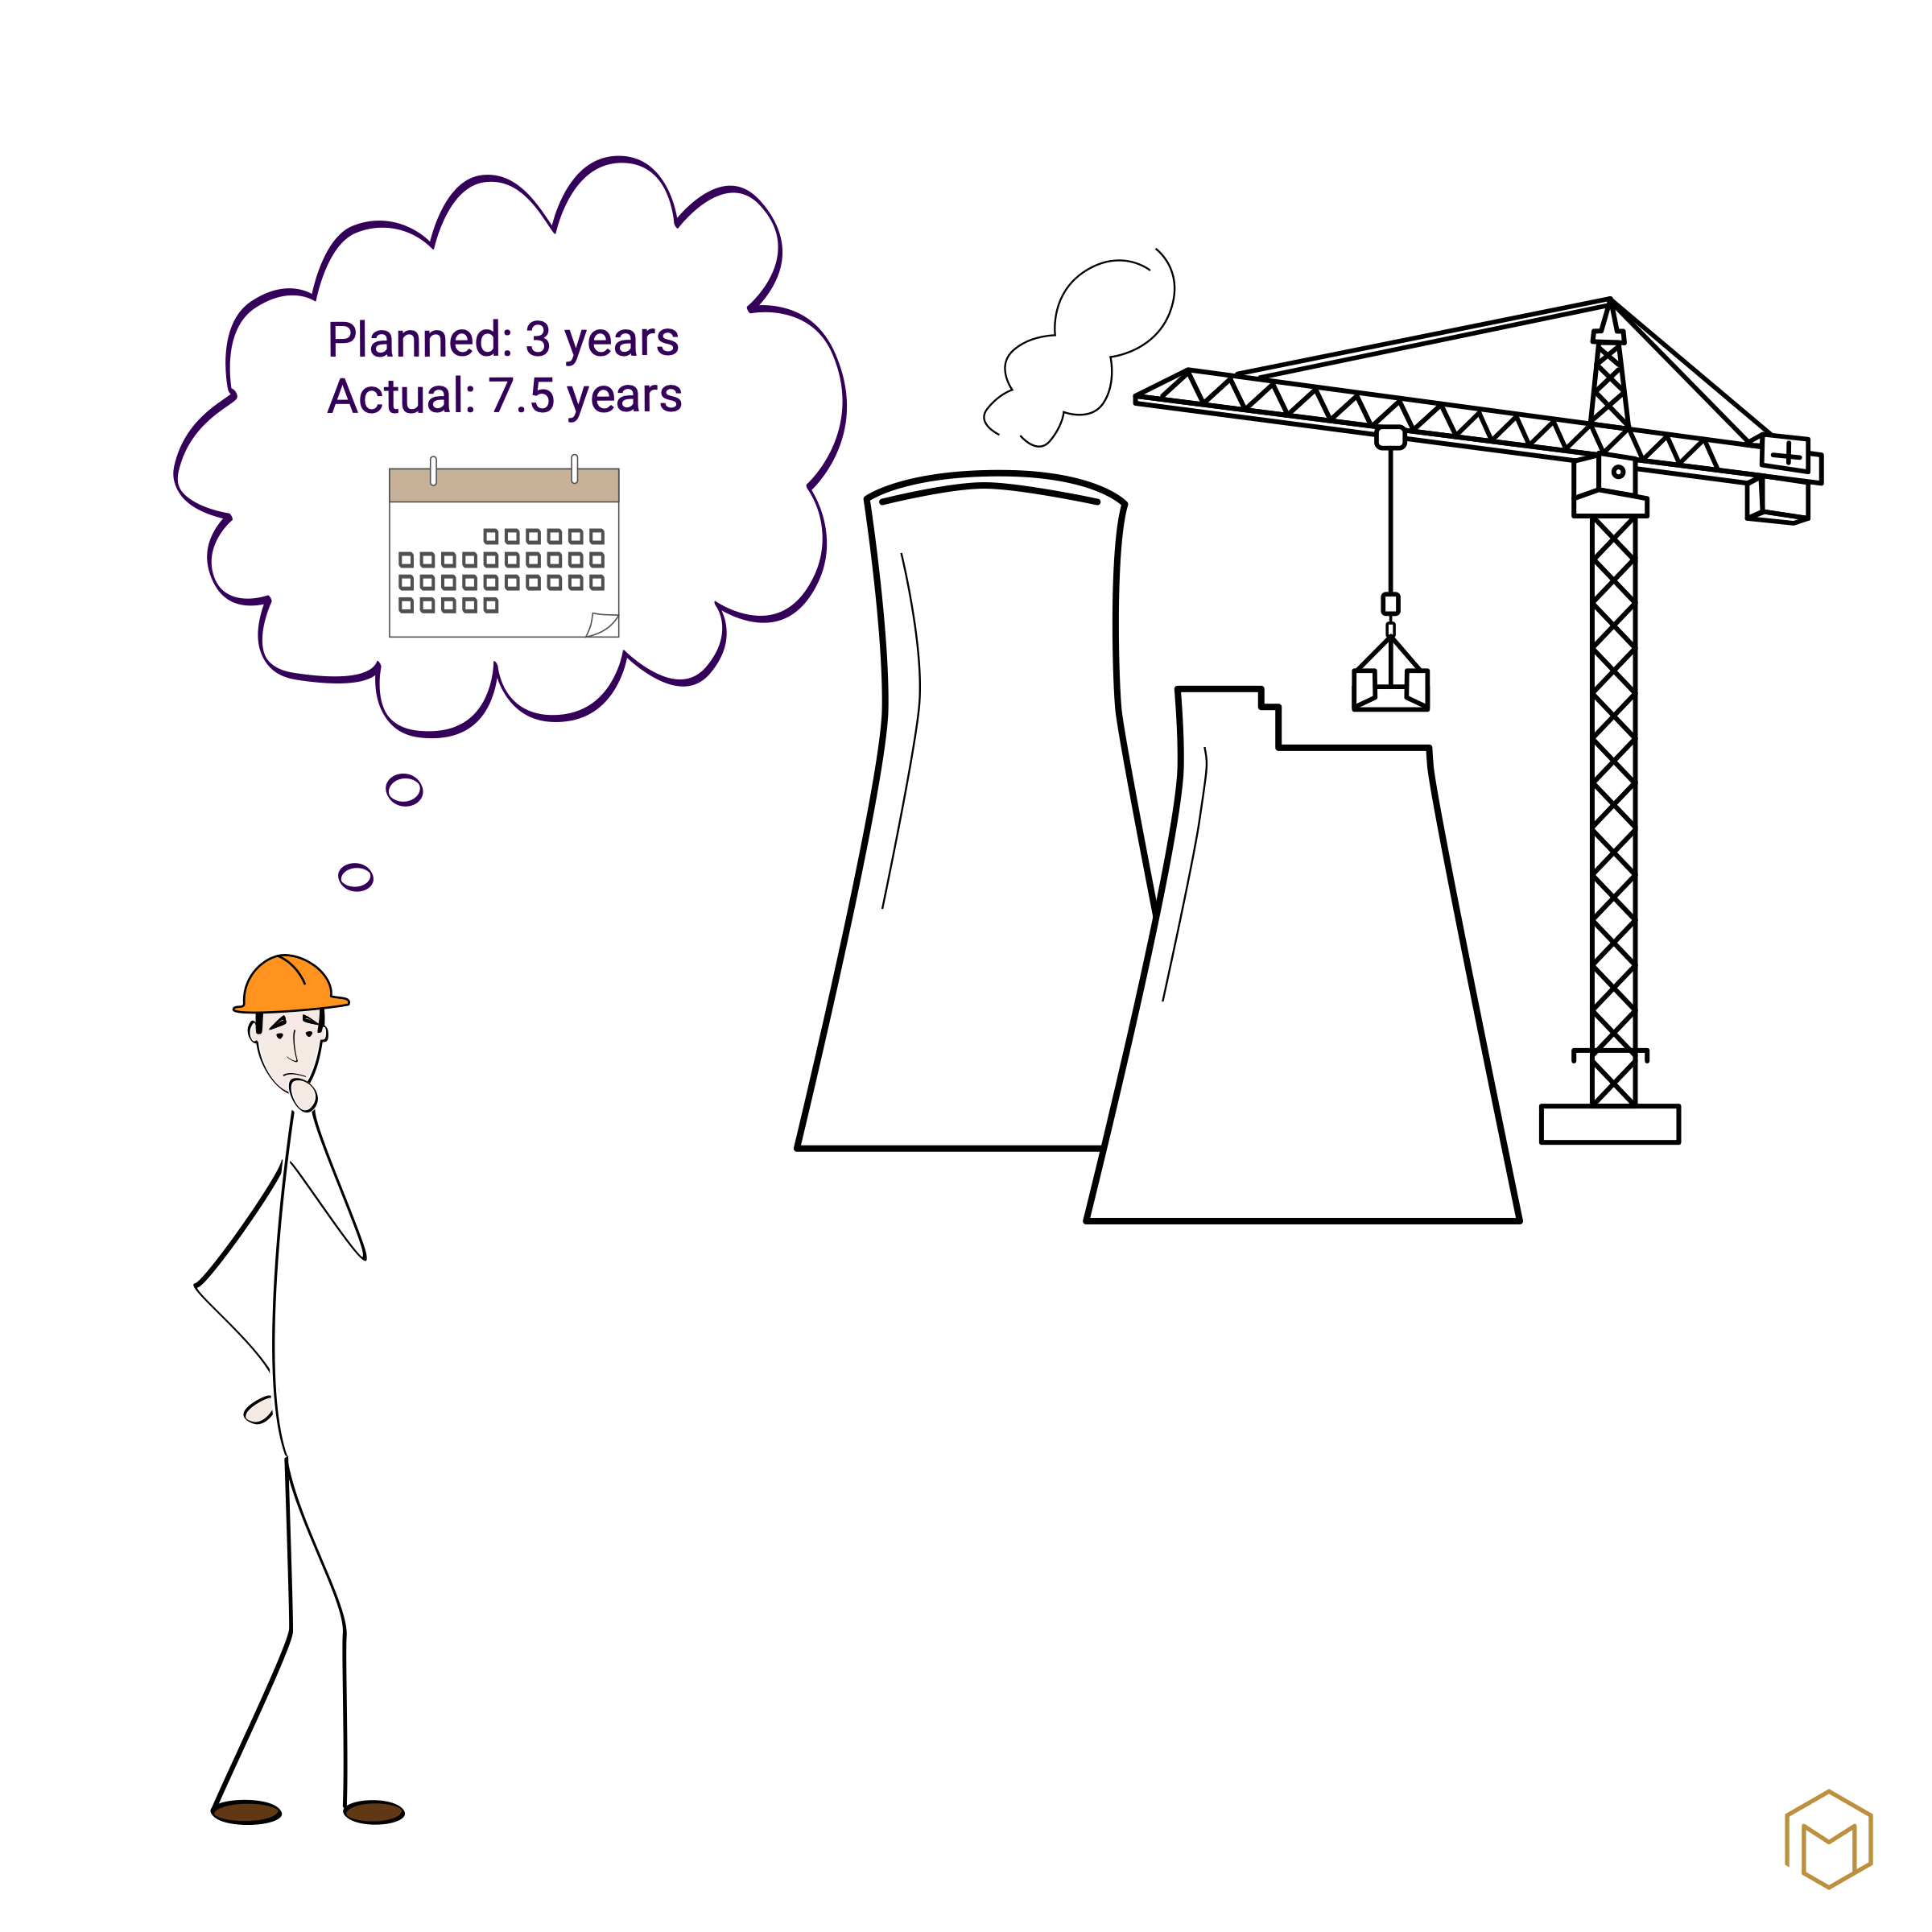
The key findings: 91.5 per cent of all major projects fail to meet their budget, schedule or value proposition. Only 0.5 per cent meet all three. The distribution is not symmetrical; it is ‘fat-tailed’, as Flyvbjerg calls it. Most projects deviate moderately from the plan, but a significant proportion end up at extremes, which make the average figures misleading. In the case of IT projects, 18 per cent exceed the budget by more than 50 per cent, with an average overspend of 447 per cent within this ‘tail’. The most extreme case in Flyvbjerg’s database: a small workflow adjustment, budgeted at $1,500, ended up costing $425,000. That is a factor of 283. The fat-tail effect affects most types of project. Exceptions are five modularly structured categories: solar, wind and fossil fuel power stations, electricity transmission and road construction. These follow an approximately normal distribution. All other projects, from IT through construction to nuclear power, are risk-asymmetric. The probability of dramatically overshooting the budget is unusually high for these projects.
This is the reality for hundreds of thousands of project managers worldwide. The planning fallacy is the statistical norm.
Why this happens
Kahneman explains this effect by referring to the difference between an internal and an external perspective. From an internal perspective, the task at hand is thought through in detail: what steps are necessary, how will they be carried out, and what is the ideal course of action? Setbacks and interruptions appear to be exceptions.
From an external perspective, one would ask: how long have similar tasks taken in the past? This question is uncomfortable because it shatters the illusion of control. The answer is usually: longer than planned.
A team that plans its task in detail and knows every step systematically underestimates it. Looking to the past helps to plan more realistically.
How to reduce the factor
With some developers, I managed to systematically improve the factor to 1.7. The method was: consistent comparison between the plan and reality, without any penalties.
What was planned? How long did it take? These two questions were asked as part of the feedback process after each completed work package. The developer was encouraged to see for themselves where their intuition was reliable. Over time, a realistic self-image developed: ‘I’m usually right when it comes to database work. With UI changes, I always misjudge by a factor of 2. With integration tasks, by a factor of 3.’
The absence of punishment was the key prerequisite. Anyone criticised for poor estimates will be more cautious the next time. They learn to hide their intuition.
Reference Class Forecasting is the formal version of the same principle described by Bent Flyvbjerg in 2003. Instead of planning a new task in detail, the method looks for a class of comparable past projects. The actual duration of these comparable projects is taken as the baseline for the estimate. The organisation’s own detailed planning takes a back seat. The British Government has since made its use mandatory for all major government projects. The Danish Transport Authority does the same. Studies show that the method reduces the average cost overrun by around 30 per cent compared with traditional estimation methods.
If there is no reference class
Not every project has a reference class. Anyone setting up an AI model to classify customer enquiries may find that there are none, or too few. What now?
Two answers. Firstly: use the universal factor. A multiplier of 2 to 2.5 applied to the naive estimate is a reasonable baseline assumption.
Secondly: always treat a project without a reference class as an experiment. It should be planned accordingly: short milestones, regular reviews, and a willingness to reassess after each milestone. This is the only honest form of planning under genuine uncertainty.
After the first milestone, you know more than you did at the start. You have created your own reference class. Use it to reassess the next milestones.
We all underestimate the duration of our projects. From putting up a shelf to building a power station. The first step is realisation. The second is a process that you apply every day.